The Student Bundle includes the following financial model templates:
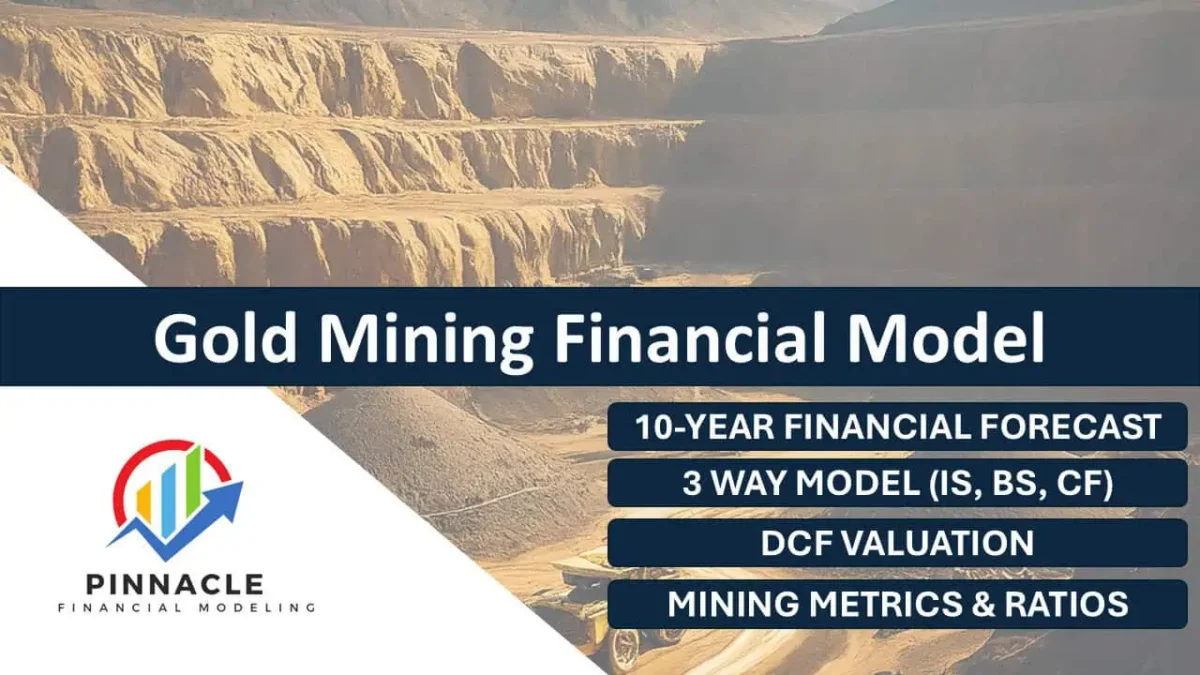
- Gold Mining Financial Model
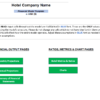
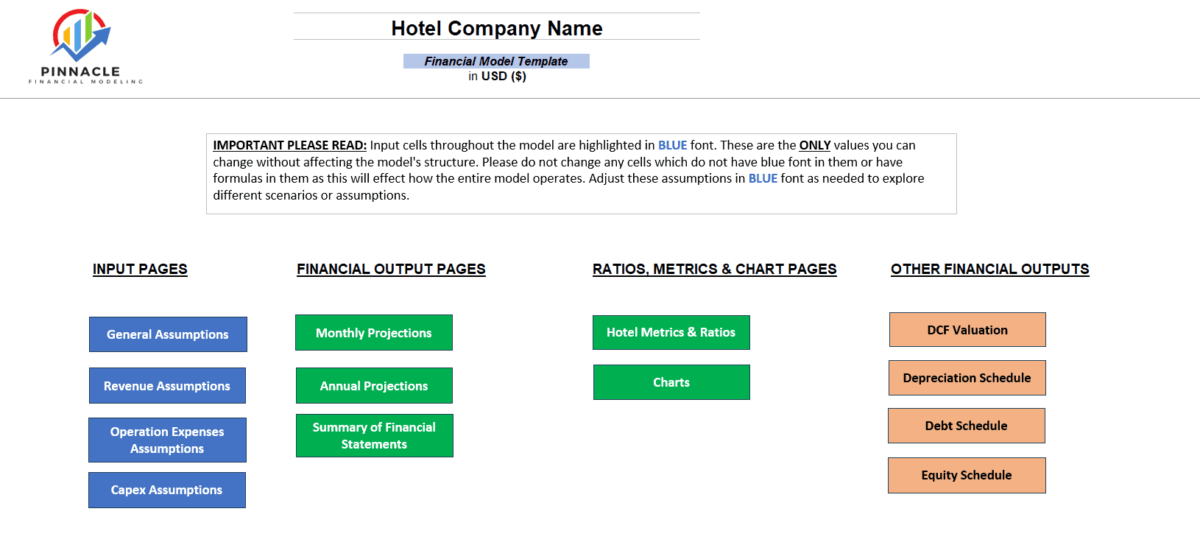
- Hotel Financial Model
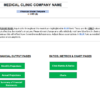
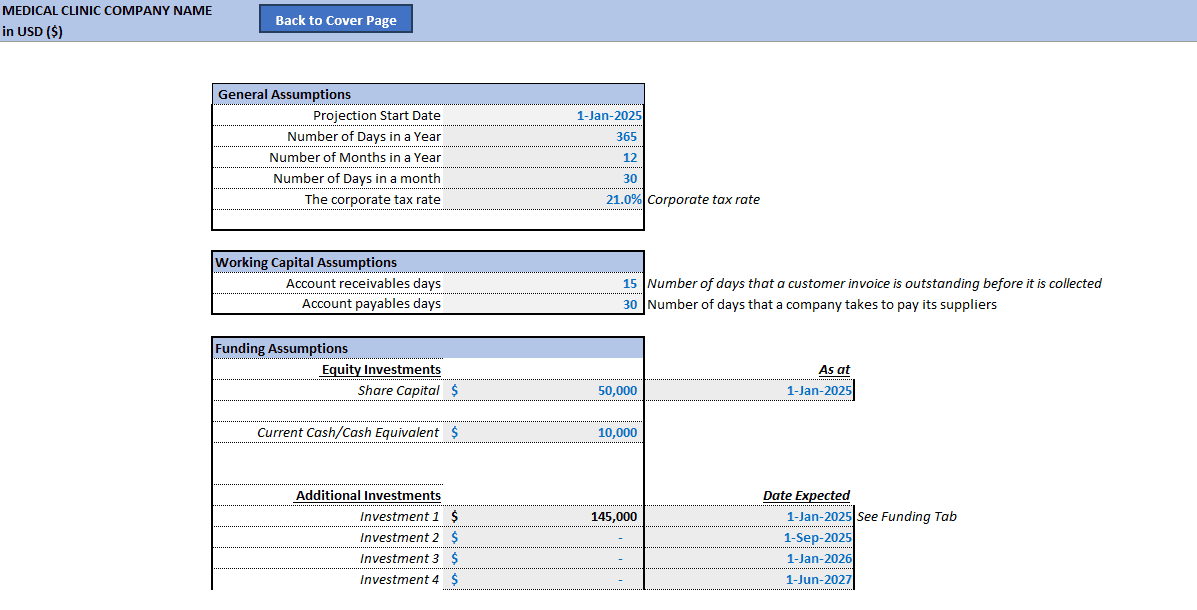
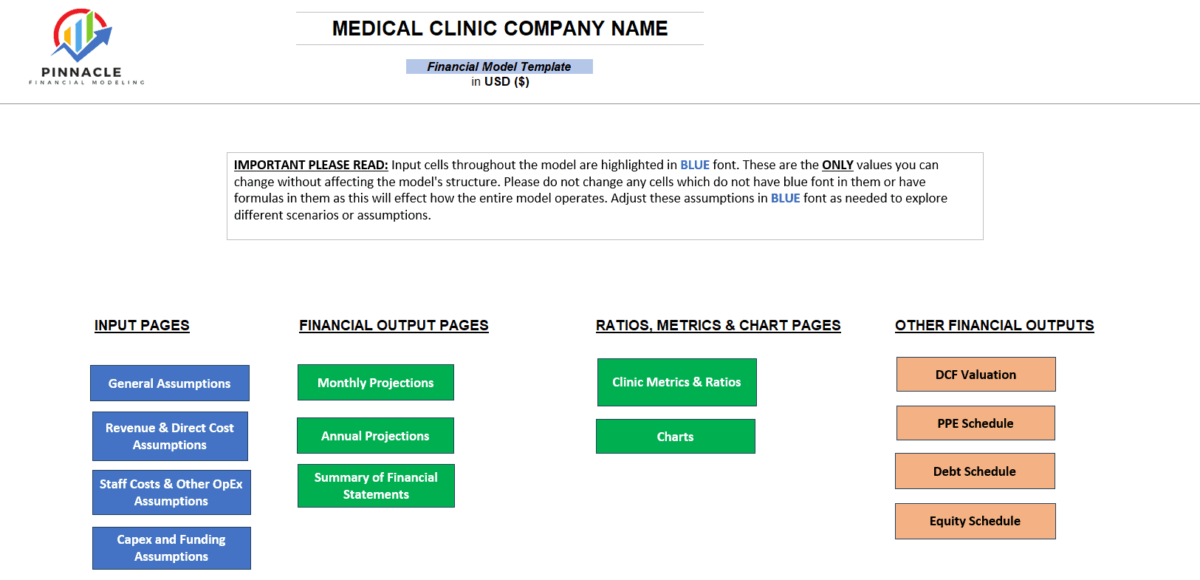
- Medical Clinic Financial Model
- Mobile App Financial Model
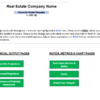
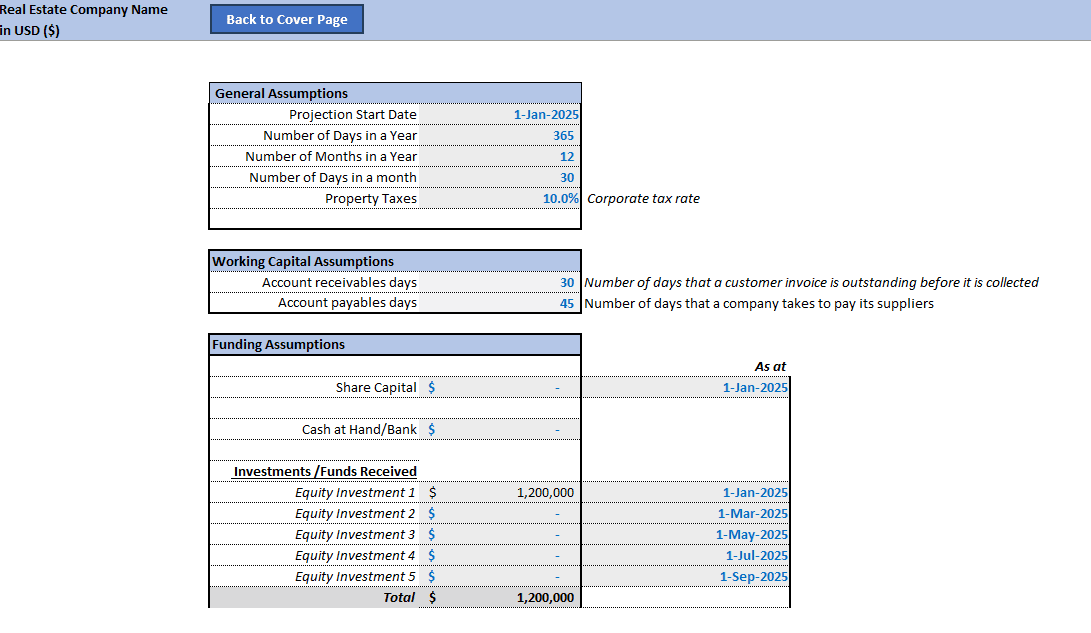
- Real Estate Financial Model
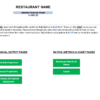
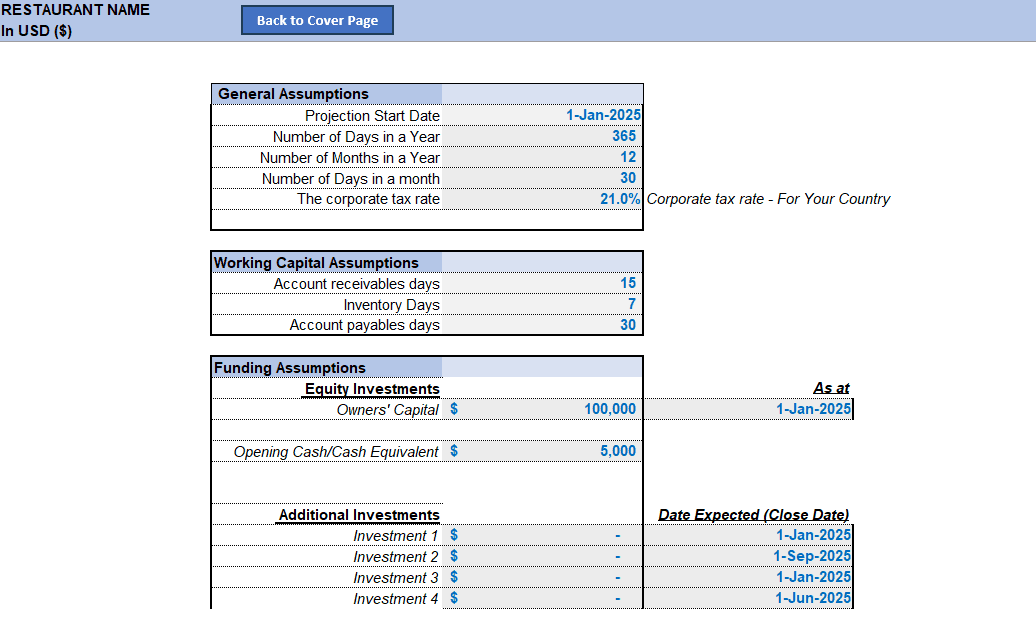
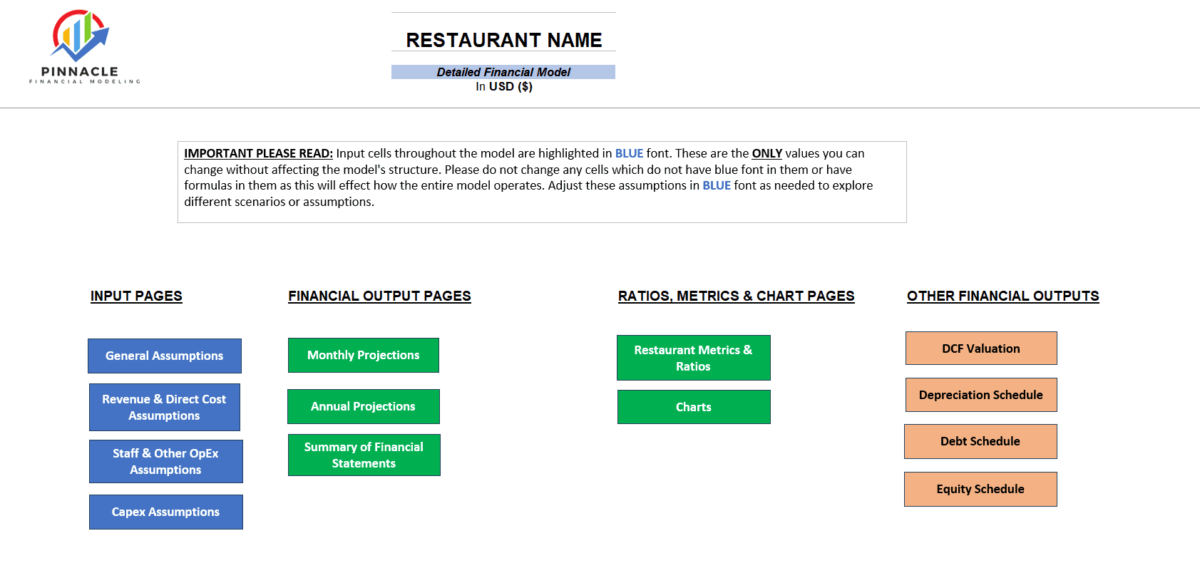
- Restaurant Financial Model
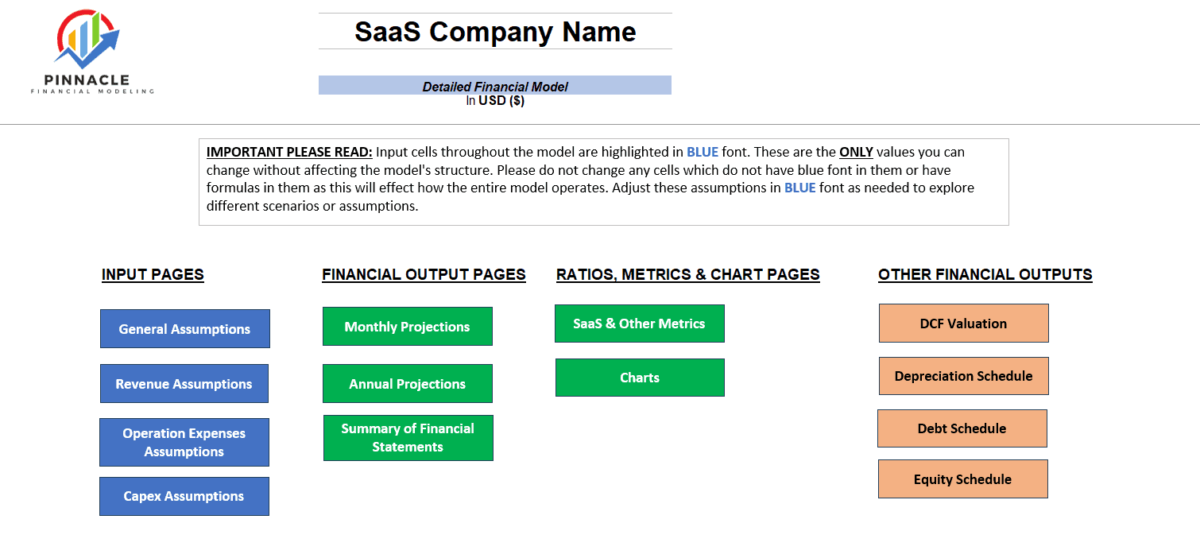
- Saas Financial Model
This Student Bundle includes financial model templates from various industries that Students may be interested in learning about and seeing how each Business Model operates. Each of these has unique Business Models, Company Revenue Drivers, Operating Metrics, and KPIs – perfect for any student looking to understand how each unique business works and their relative valuations. We have included six specific industry financial models in the software: the A Service (SaaS) financial model, mobile app financial model, restaurant financial model, hotel financial model, medical financial model, and real estate financial model. This Bundle, consisting of the seven models, is currently valued at $350. However, we offer students a 57% discount and sell this Bundle for only $150.
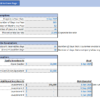
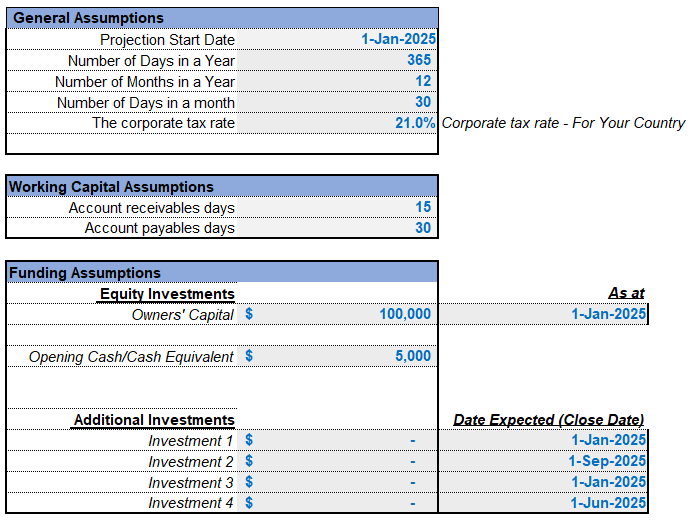
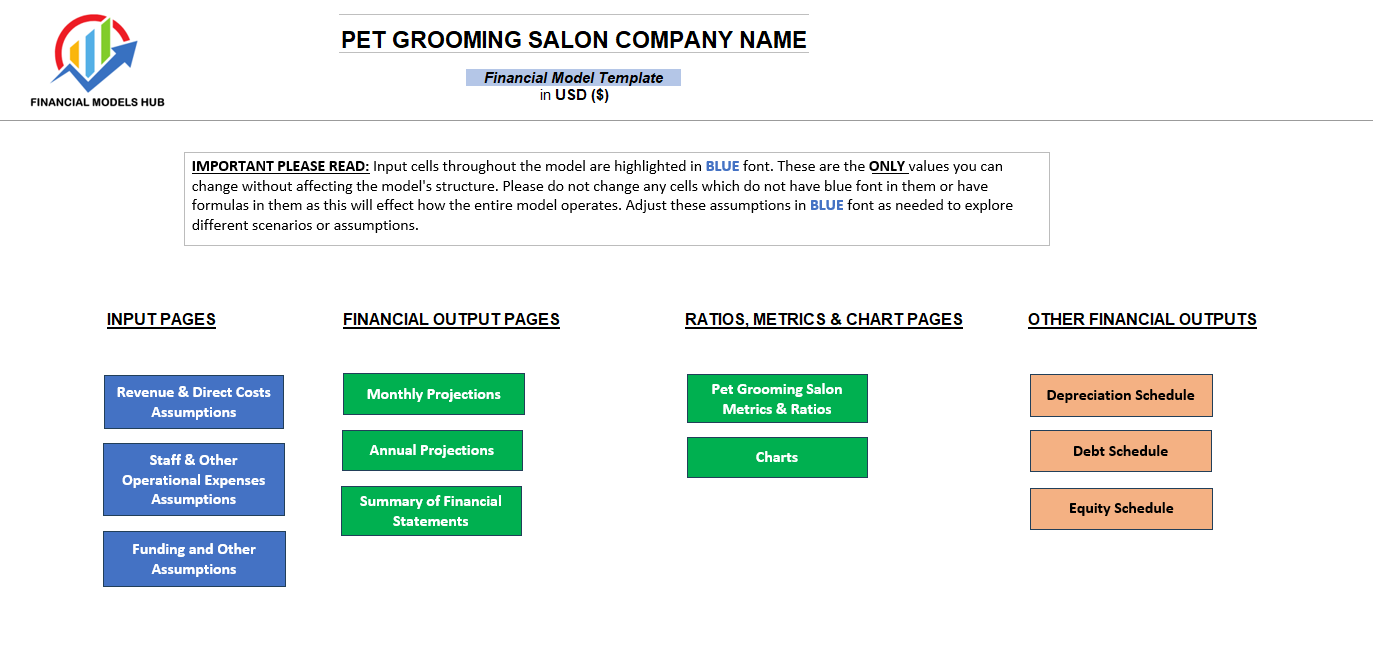
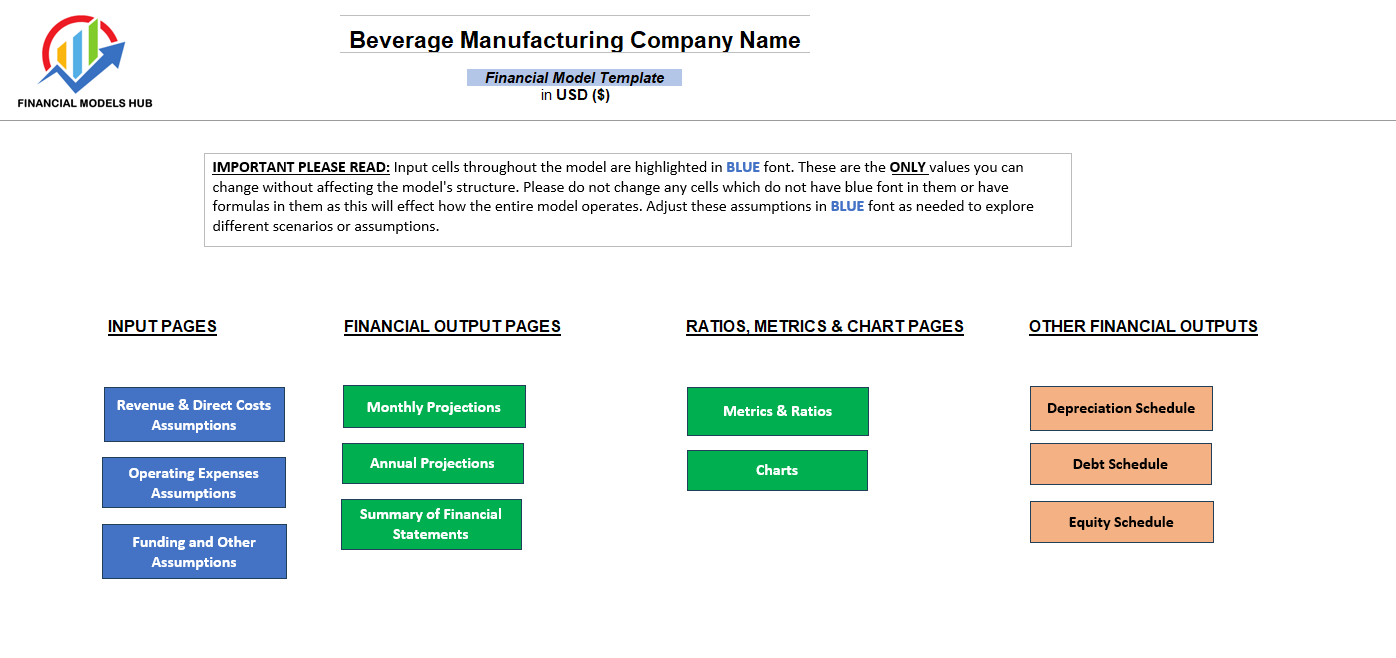
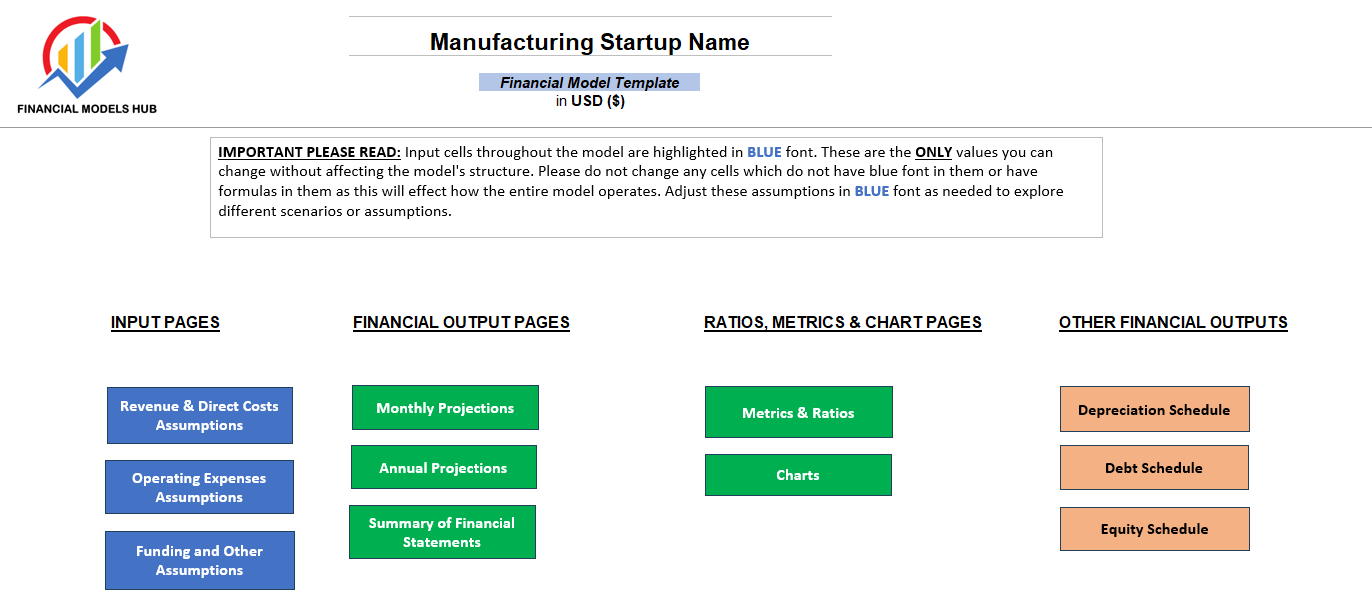
Model Assumptions for each Model: Revenue & Direct Costs Assumptions
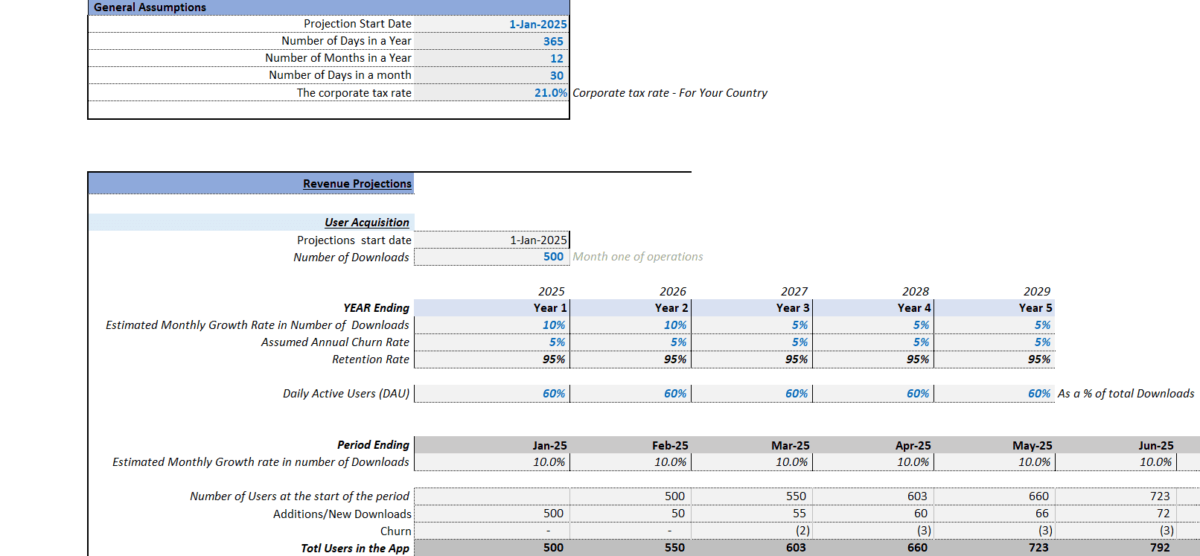
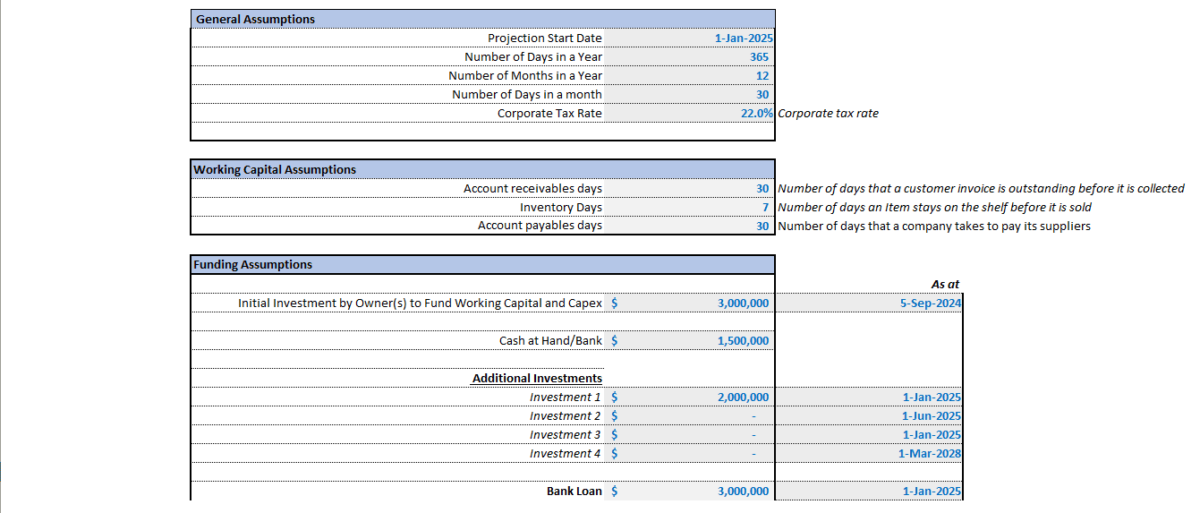
Starts with basic model questions on the start date of the model and tax rate assumptions. Revenue assumptions are the anticipated factors that drive a company’s income generation over a specific period. These assumptions form the basis for financial projections and are crucial for planning and decision-making.
In each model, we have included detailed inputs on Revenue drivers:
- SaaS: Detailed inputs on # of users, estimated monthly growth rate in users, assumed annual churn rate %, subscriber breakdown in different tier levels, tiered subscription fees offered, and direct costs, including customer acquisition costs.
- Mobile App: Detailed inputs on # of users, estimated monthly growth rate in users, assumed annual churn rate %, Daily Active Users, Number of Downloads, Revenue Streams including App Subscription Fees, Free vs Paying App users and more
- Restaurant: Specific inputs on # of tables, average daily turnover per table, average order value per table, average daily revenue, working days per week, open weeks per year, utilization (occupancy) rate, food costs, direct labor costs
- Hotel: Detailed inputs on the Number of Rooms by category, Maximum Capacity Per Room, Rates Per Day Charged, Estimated Occupancy By Room Type, Food and Drinks Revenue, Average Room spending, and Other Revenue Streams in the Hotel (Event and Conference, Spa and Wellness, Retail and Gift, and others).
- Medical Clinic: Detailed inputs on Patients Treated Monthly Per Clinic, Growth in the Number of Patients Treated, Clinic Buildout, Revenue Streams including Online Consultation and In-Clinic Consultation, Medicine Sales, Diagnostic Services, Diagnostic Patients Treated, and Part-Time Specialist Revenue.
- Real Estate: Detailed inputs on Land costs, Property Value, Construction Costs Per Unit, Rental Income, Property Management Fees and others
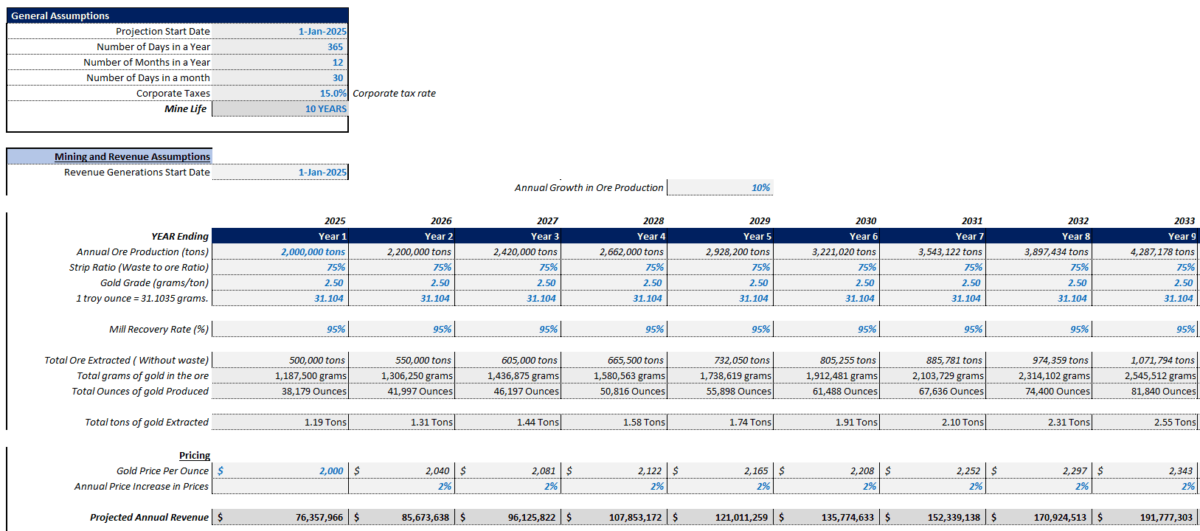
- Gold Mining: Detailed inputs on Annual Ore Production (tons), Strip Ratio (Waste to Ore Ratio), Gold Grade (grams/ton), Mill Recovery Rate (%), Total Ore Extracted (without waste), Total Grams Of Gold in the Ore, Total Ounces of Gold Produced, Total Tons of Gold Extracted, Gold Price Per Ounce
We have also included Direct Costs based on each business’s Revenue category and the most relevant Cost fields as a % of Revenue to forecast going forward.
Operating Expenses Assumptions
Operating expense assumptions are typically based on historical data, industry benchmarks, market trends, and management’s judgment. They are crucial for estimating the business’s total cost and determining profitability. Like revenue assumptions, it’s essential to regularly review and adjust operating expense assumptions to reflect changes in the business environment and ensure the accuracy of financial forecasts. In all our models we have included detailed inputs on Staff costs by Category Type (Management, Development Team, Customer Service Team, Sales Team, Other Department) and Typical Operational Expenditure items expected for each business (i.e., Rent, Office Supplies, Dues and Subscriptions, Airfare, Accommodation, Other). However, you can add any other expenses you think may be relevant.
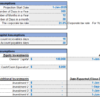
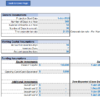
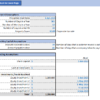
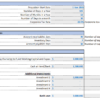
Capex Assumptions
Capital expenditure (Capex) assumptions refer to the anticipated investments a company plans to make in long-term assets, such as property, plant, equipment, and technology, over a specific period. These assumptions are crucial for financial planning, budgeting, and forecasting, impacting the company’s cash flow, profitability, and growth prospects. We have included a Fixed asset cost assumption schedule for the main items likely to be on a company’s capex sheet and a Use Of Funds assumption list with a corresponding pie chart.
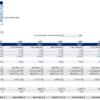
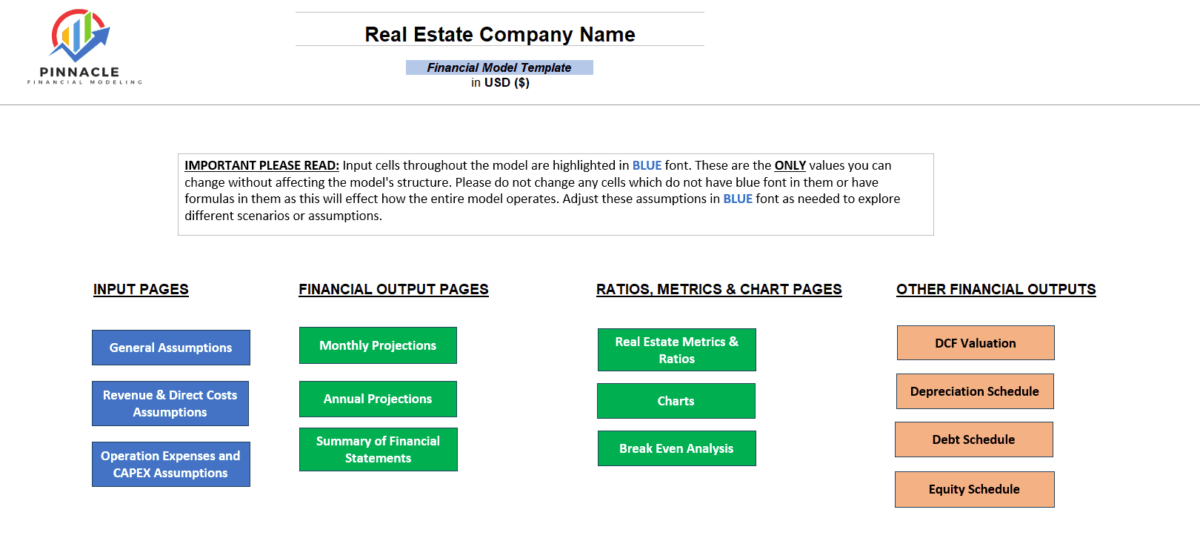
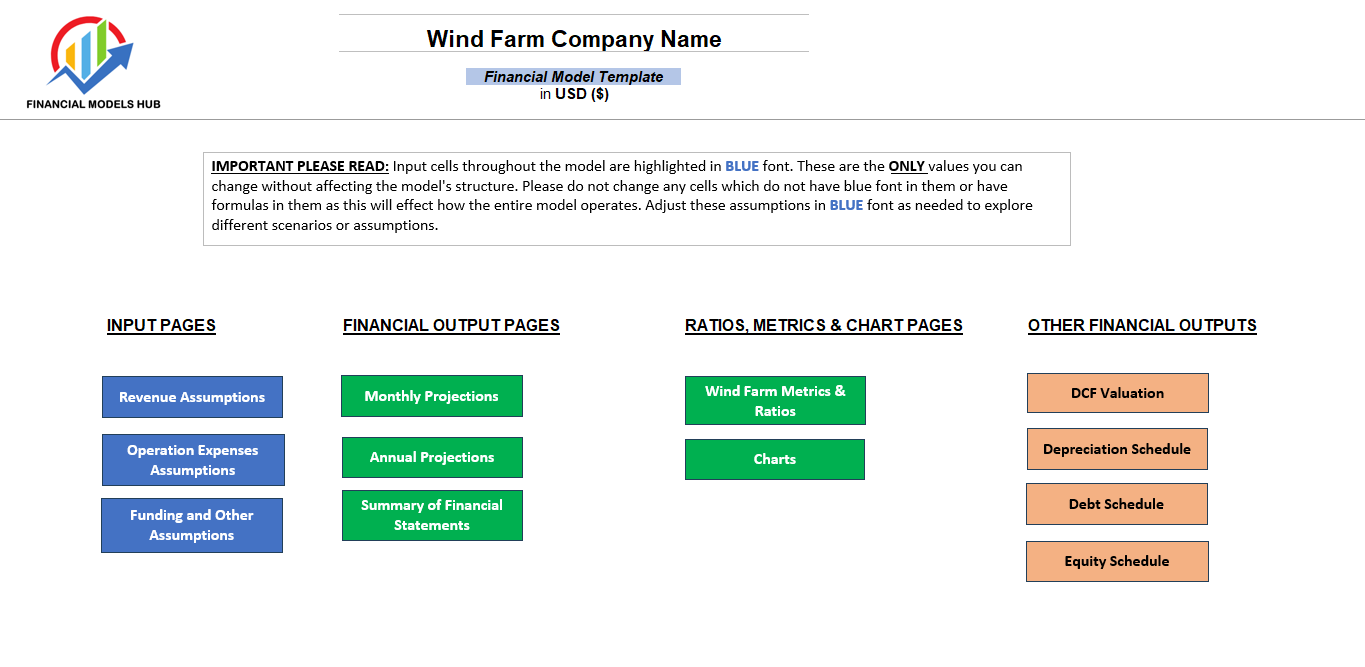
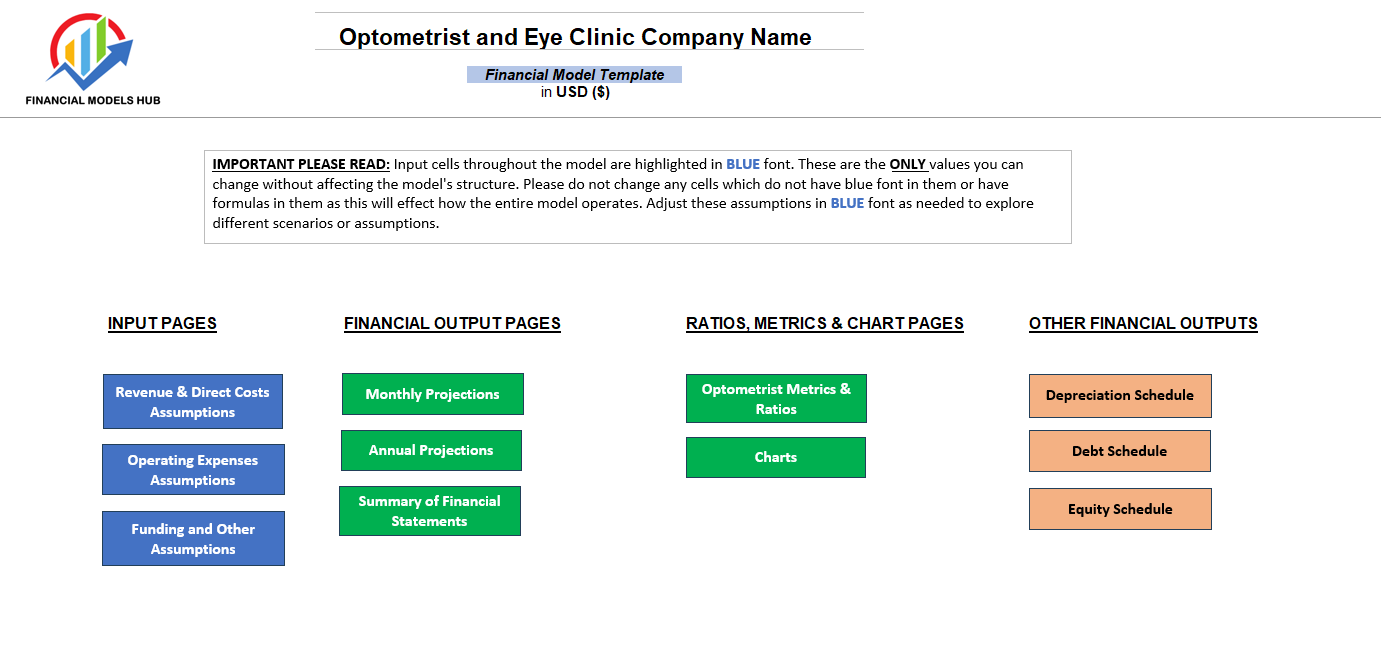
Monthly Projections
We have broken down projections Month-by-month when projecting income statements, balance sheets, and cash flow statements. The monthly estimates are provided over a five-year or ten-year time frame. This is particularly useful for businesses looking at month-on-month trends and insights in the industry, which leads to better decision-making and budgeting should there be a need to either raise more capital, pursue growth opportunities from excess capital or pay down interest-bearing debt. Monthly projections also help a business ascertain seasonal performance when looking at growth projections on a month-over-previous-years-month basis.
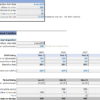
Annual Projections
The model has Annualized Financial Projections of Income Statement, Balance Sheet, and Cash Flow Statement over a 5-year or 10-year time frame. Annual projections provide an excellent overview of expected revenues, expenses, profits, cash flow, and other key financial metrics for the upcoming year. Yearly predictions are essential for any company’s strategic planning, budgeting, fundraising, and performance evaluation at any stage of its business cycle.
Financial Metrics & Other Metrics
Financial metrics and Ratios have been included, which highlight Revenue and Profitability, Profitability Ratios, Operational Metrics, and Revenue by Category over a 5-year or 10-year time frame.
Summary of Financial Statements
Summarized Financial Statements over a five-year or ten-year time frame help for better snapshots of financial performance. Income Statement, Balance Sheet, and Cash Flow Statement are all provided.
Charts
Charts available including Profitability Margins (Gross Profit Margin, EBITDA Margin, and Net Profit Margin), Revenue vs Direct Costs Projections, Revenue by Category, and Cashflow Summary
DCF Valuation
We have included a Discounted Cash Flow (DCF) Valuation model showing the Business’s Net Present Value (NPV) based on growth rates and assumptions. Weighted Average Cost of Capital Assumptions include Risk-Free rate, Beta, Risk Premium, and Equity Risk Premium. A DCF valuation is a method used to estimate the value of an investment, business, or asset by discounting its expected future cash flows to present value. It is based on the principle that the value of an investment is determined by the present value of its future cash flows. The DCF valuation technique is widely used in finance, investment analysis, and corporate finance for making investment decisions, determining the fair value of securities, and evaluating the worth of businesses.
Depreciation Schedule
The detailed depreciation schedule shows additions/disposals to the business’ fixed asset register. Sections are included for each company’s main fixed asset items.
Debt Schedule
Debt schedule provided with interest rate assumptions and payback period assumptions included.
Equity Schedule
Equity schedule provided with assumptions on all investments into the business by investors or owners.